
 US Dollar (USD)

2026 Jan 9th
How to Calculate Average Inventory for Better Stock Control
How to Calculate Average Inventory for Better Stock Control
Figuring out how to calculate average inventory is a lot simpler than most people think. At its core, you just add your beginning inventory to your ending inventory and divide that number by two.
This basic formula gives you a stable snapshot of the stock you typically have on hand, smoothing out all the day-to-day ups and downs and giving you a solid baseline for your restaurant's financial health.
Why Average Inventory Is Your Secret Weapon for Profitability
Does this sound familiar? You're completely sold out of slushy syrups one week, but the next your walk-in is overflowing with expired produce. It's a common headache for foodservice operators, feeling like you're constantly guessing your stock levels. This cycle of overstocking and understocking doesn't just cause stress—it directly eats into your profits.
Let's say you're a café owner. In May, you couldn't keep Slush Puppie syrups on the shelf during a heatwave. But in June, you're staring at a cooler full of unsold specialty cheeses. If you only look at your end-of-month numbers, you're getting a warped picture. One month looks like a stockout crisis, the next a cash flow disaster.
Moving Beyond Guesswork
This is exactly where understanding your average inventory becomes a game-changer. It's not just some accounting task; it's a critical health check for your entire operation. By calculating this one key metric, you can completely transform how you manage your business.
- Refine Your Purchasing: You can finally stop making blind orders. Start buying what you actually need based on a stable average, not just temporary spikes or dips.
- Slash Food Waste: A clear view of your typical stock levels helps you manage perishable items way more effectively, cutting down on the spoilage that kills your margins.
- Unlock Cash Flow: Every dollar tied up in excess inventory is a dollar you can't use for payroll, marketing, or growing the business. Getting your stock levels right frees up that valuable capital.
Average inventory gives you the balanced perspective you need to stop reacting to daily inventory swings and start making strategic, data-driven decisions that actually boost your bottom line.
Ultimately, knowing how to calculate your average inventory is the first real step toward ending the inventory guessing game for good. It provides the foundational data you need to build a smarter purchasing strategy, ensuring you have enough of what sells—like your popular Frostline soft serve mixes—without tying up precious cash in items that just sit on the shelf.
The Foundational Formula for Calculating Average Inventory
When you're ready to get a handle on your typical stock levels, the simplest and most common place to start is with the basic average inventory formula. This method works for any type of operation, from a bustling bistro to a small café, and it gives you a clear, reliable snapshot of your stock.
The formula itself is refreshingly straightforward: (Beginning Inventory + Ending Inventory) / 2.
This calculation takes the value of your stock at the start of a period, adds the value at the end, and then divides by two. What you get is the midpoint, a simple average that smooths out the daily chaos of deliveries and sales. This gives you a much more stable number to work with than just looking at a single day's stock count.
Putting the Formula into Practice
Let's walk through a real-world scenario. Imagine you run a local restaurant and want to calculate your average inventory for bulk cooking oils for the month of April. Your goal is to figure out if you're overstocking this essential but costly category.
First, you need the monetary value of your stock at the beginning and end of the month. To do this, you'll conduct a physical count and multiply the quantity of each item by its cost.
- Beginning Inventory (April 1st): You count your stock and find you have $1,200 worth of cooking oils on the shelves.
- Ending Inventory (April 30th): After a month of sales and new deliveries, your final count shows $1,600 worth of oil remaining.
Now, you just plug these values into the formula:
Average Inventory = ($1,200 Beginning Inventory + $1,600 Ending Inventory) / 2
Average Inventory = $2,800 / 2
Average Inventory = $1,400
This calculation tells you that, on average, you held $1,400 in cooking oil inventory throughout April. This single number is the foundation for deeper analysis, helping you understand how much cash is tied up in one specific category. Whether you're tracking high-value items or everyday staples like your spices and seasonings, this method provides the clarity needed for smarter purchasing.
The Importance of Consistency
One of the most critical factors for getting accurate numbers is consistency in your valuation method. Most foodservice businesses use a First-In, First-Out (FIFO) approach, where you assume the first items purchased are the first ones sold. Other methods exist, like Last-In, First-Out (LIFO) or Weighted Average Cost, but FIFO is the industry standard for a reason—it mirrors how you actually use perishable goods.
Whichever method you choose, the key is to stick with it.
Switching between valuation methods from one period to the next will skew your data, making it impossible to accurately compare inventory levels over time. Consistent data is reliable data, and it's essential for making informed decisions about your stock. Nailing this foundational knowledge ensures you can confidently calculate your average inventory and begin building a more profitable operation.
Need More Accurate Numbers? Try These Advanced Inventory Calculations
The simple average formula is a great starting point, but let's be honest—it doesn't always tell the whole story. If you're running a business with serious seasonal swings or an inventory full of items with wildly different price tags, you need a more sophisticated approach to get a true read on your operational health.
These more specific formulas help you move beyond a simple snapshot, giving you the detailed insights needed for smarter purchasing and better financial planning.
The Period Average Method for Seasonal Swings
Does your patio bar stock up on cases of bar and drink mixes every May, only to let those levels dwindle come October? If your business has predictable seasonal peaks and valleys, the period average method is your best friend. It's designed to give you a more accurate picture over a longer timeframe, like a full year.
Instead of just looking at the start and end of the year, you calculate the average for smaller, consistent periods (like each month) and then average those averages.
Here's the game plan:
- First, calculate the average inventory for each month of the year using the basic formula we already covered.
- Next, add all twelve of those monthly averages together.
- Finally, divide that total by 12.
This method prevents a few high-stock summer months from skewing your entire annual average. The result is a much more balanced and realistic view of your inventory value over the course of a full business cycle.
The Rolling Average for Keeping a Real-Time Pulse
In a fast-paced kitchen or bar, a monthly calculation can feel ancient the moment you run the numbers. For a more dynamic, up-to-the-minute perspective, the rolling average is the way to go. It isn't tied to rigid calendar periods like a month or a quarter; instead, it's continuously updated.
You might, for instance, track a 30-day rolling average. Every day, you add the newest day's inventory value and drop the value from 31 days ago. This keeps your average fresh and highly responsive to what's happening right now.
This is invaluable for tracking high-turnover items where daily fluctuations really matter—think fresh produce or popular Frostline soft serve mixes. It helps you react to demand changes in real-time instead of waiting until the end of the month to discover a problem.
The Weighted Average for Valuing Your Most Expensive Stock
What happens when your storeroom holds both high-ticket and low-cost items? A catering company, for example, might have thousands of dollars tied up in specialty meats but only a couple hundred in janitorial supplies. A simple average treats a dollar's worth of paper towels the same as a dollar's worth of prime rib, which just doesn't reflect your financial reality.
The weighted average calculation fixes this by giving more importance—or "weight"—to your higher-cost items. This gives you a far more accurate financial picture by focusing on the products that lock up the most cash.
Let's look at that catering company's inventory again:
- Specialty Meats: 100 units at $50/unit = $5,000
- Artisanal Cheeses: 50 units at $20/unit = $1,000
- Bulk Spices: 200 units at $5/unit = $1,000
- Janitorial Supplies: 300 units at $1/unit = $300
Here, the specialty meats represent a huge chunk of the total inventory value. A weighted average reflects their significance, ensuring your financial analysis is dialled into the items with the biggest impact on your cash flow. Knowing which products carry the most financial weight, like your premium Chicken Pieces, is the key to smarter inventory control.
Choosing Your Average Inventory Method
Deciding which formula to use can feel tricky, but it really comes down to your business's unique rhythm and needs. A small café with stable stock might be fine with the simple average, while a bustling seasonal resort will get much better insights from a period average.
To make it easier, here's a quick comparison of the methods we've covered.
| Calculation Method | Best For | Example Scenario | Key Benefit |
|---|---|---|---|
| Simple Average | Businesses with stable, consistent inventory levels. | A small coffee shop with predictable weekly orders. | Quick, easy, and provides a solid baseline. |
| Period Average | Businesses with predictable seasonal fluctuations. | An ice cream parlour that's busy in summer, slow in winter. | Smooths out seasonal peaks for a more accurate annual view. |
| Rolling Average | Fast-paced operations needing real-time data. | A busy restaurant tracking daily use of fresh produce. | Highly responsive and ideal for managing high-turnover items. |
| Weighted Average | Businesses with a mix of high- and low-cost stock. | A steakhouse holding expensive cuts of meat and cheap dry goods. | Provides a truer financial picture by focusing on high-value items. |
Ultimately, picking the right method isn't just about crunching numbers—it's about gaining a clearer understanding of your inventory's true value and behaviour. By aligning your calculation with your operational reality, you empower yourself to make much smarter decisions for your bottom line.
How to Use Average Inventory to Make Smarter Decisions
Figuring out your average inventory is a great first step, but the real power comes from what you do with that number. Think of it as a key ingredient in a recipe for smarter business decisions. When you plug it into a couple of other crucial formulas, you start to unlock insights that have a direct impact on your profitability, efficiency, and even customer satisfaction.
The number itself tells you what you typically have on your shelves, but its true value is revealed when you use it to calculate two game-changing metrics every foodservice operator needs to track: your Inventory Turnover Rate and your Reorder Point.
Calculating Your Inventory Turnover Rate
Your inventory turnover rate tells you how many times you sell through and replace your entire stock over a specific period. It's a direct measure of how efficiently you're managing your cash flow and your assets. A high turnover rate is usually a great sign—it means products are selling well. A low rate, on the other hand, can be a red flag for overstocking or slow-moving items.
The formula is refreshingly simple:
Inventory Turnover Rate = Cost of Goods Sold (COGS) / Average Inventory
Let's say you run a busy pizzeria. Last quarter, your Cost of Goods Sold for cheese was $15,000, and you determined your average inventory value for cheese was $3,000.
Your turnover rate is $15,000 / $3,000 = 5.
This means you sold through and replenished your entire stock of cheese five times during that quarter. For Canadian businesses managing bulk supplies, this is a vital insight. As noted in Statistics Canada's retail analysis, this calculation is fundamental for tracking how often inventory is sold and replenished annually—a key performance indicator in a market where retail spending hit $839.8 billion.
From Turnover to Reorder Point
Knowing your turnover rate flows directly into the next critical calculation: setting a data-driven reorder point. This is the specific stock level that triggers a new order. Get this right, and you'll never run out of a key ingredient during a dinner rush while also avoiding tying up precious cash in stock you don't need yet.
Here's the reorder point formula:
Reorder Point = (Average Daily Unit Sales × Delivery Lead Time) + Safety Stock
Let's stick with our pizzeria example. Your POS data shows that you go through an average of 10 blocks of mozzarella cheese per day. You know your supplier usually takes 3 days to deliver a new order. To play it safe, you always keep an extra 5 blocks on hand as safety stock to cover any unexpected demand or delivery delays.
- Average Daily Sales: 10 blocks
- Lead Time: 3 days
- Safety Stock: 5 blocks
Putting it all together, your calculation is: (10 blocks/day × 3 days) + 5 blocks = 35 blocks.
This tells you that the moment your cheese stock drops to 35 blocks, it's time to call your supplier. This simple bit of math prevents stockouts on your most critical ingredient, ensuring the pizzas keep coming out of the oven without a hitch. By connecting your average inventory to these other metrics, you transform a basic accounting figure into a strategic tool for running a smarter, leaner operation.
The decision tree below can help you visualize which calculation method is best for your initial data collection, based on whether your stock levels are stable or fluctuate.
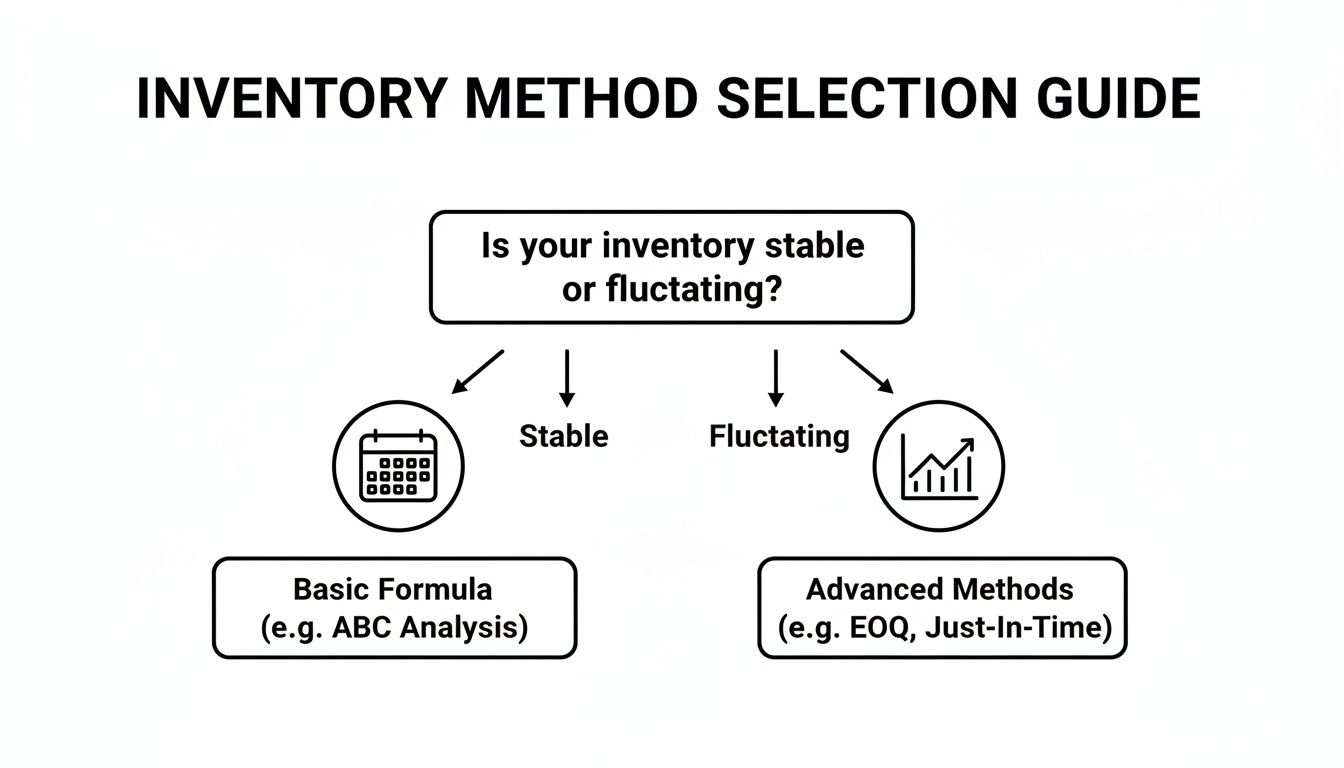
This guide shows that if your sales are pretty consistent, the basic formula will work just fine. But if you deal with seasonal rushes or fluctuating demand, you'll want to use one of the more advanced methods to get the accurate data you need for your turnover and reorder point calculations.
Practical Tips for Improving Inventory Accuracy
The average inventory formulas are powerful, but they have a critical weakness: they're only as good as the data you feed them. If your stock counts are off, every metric you calculate—from turnover to reorder points—will be unreliable. You'll end up making purchasing decisions based on phantom numbers.
The biggest threat to your data's integrity is shrinkage. It's the quiet profit killer that covers everything from theft and spoilage to simple breakage. Tackling shrinkage isn't just about saving a few dollars on lost product; it's about making your financial data trustworthy so you can make smarter business decisions.
Nail Down Your Stock Rotation and Handling Protocols
One of the quickest ways to reduce spoilage and improve accuracy is to enforce a strict 'first-in, first-out' (FIFO) system. For any business dealing with perishable goods, this is absolutely non-negotiable.
Your team must be trained to put new deliveries behind existing stock, every single time. It's a simple habit that ensures older products are always used first. This process drastically cuts down on spoilage, especially for items like your Frostline soft serve mix, where freshness is everything.
Proper handling is just as important. Teaching your team how to correctly store delicate glassware versus stacking bulk cleaning chemicals can prevent the kind of costly breakage and spills that slowly eat away at your bottom line.
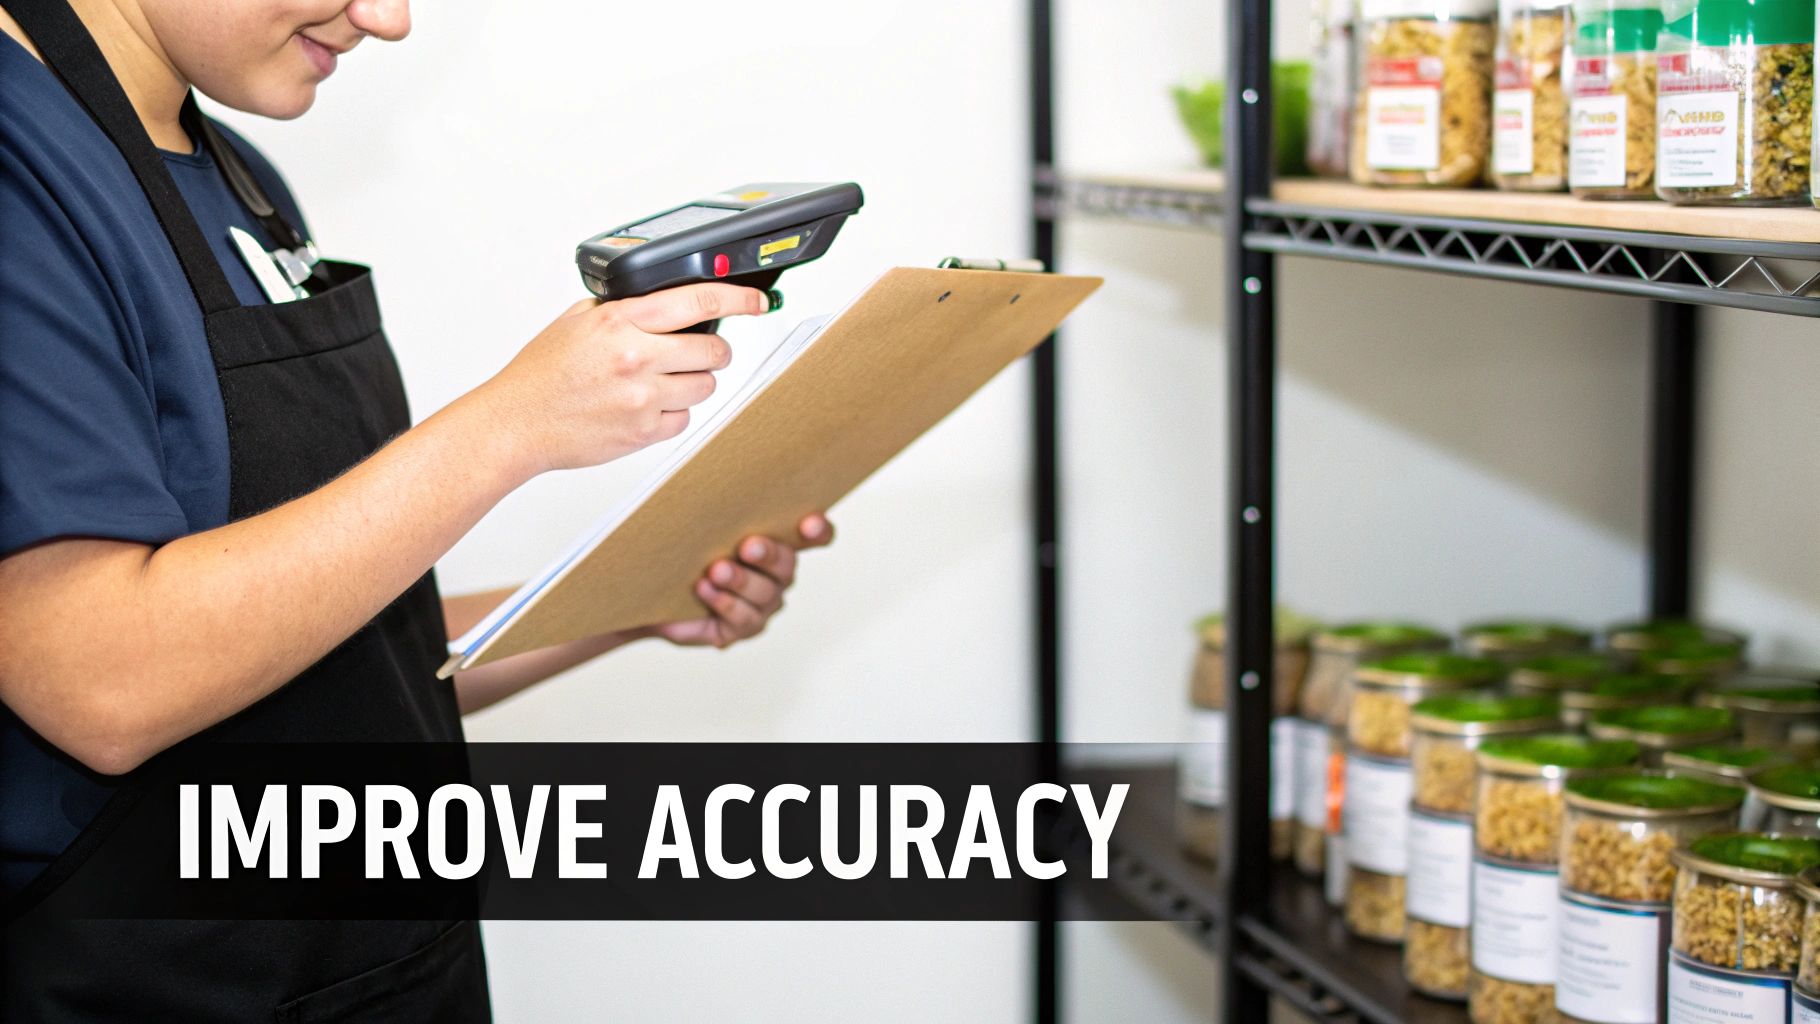
Use Cycle Counts and Technology to Your Advantage
Forget waiting for that once-a-year, all-hands-on-deck stock take that disrupts your entire operation. A much better approach is implementing regular cycle counting. This just means counting small, specific sections of your inventory on a rotating schedule. Start with your high-value items, because that's where inaccuracies will hurt your finances the most.
By doing daily or weekly cycle counts on your most expensive products—like premium spirits or specialty ingredients—you can catch discrepancies early and fix them before they become massive headaches.
This is where a modern POS system becomes your best friend. Many have built-in inventory modules that track sales in real-time, flag items when they're running low, and help you spot patterns that might indicate shrinkage.
Even better, using a barcode scanner for receiving and counting products removes the human error that comes with manual data entry. Your counts become faster and far more reliable. Given the sales fluctuations we see in Canadian retail, having precise numbers helps you stay agile. For more insight, check out the Statistics Canada reports on Trading Economics to see how these patterns can impact inventory needs.
Common Questions About Average Inventory
Once you start calculating your average inventory, you'll find it raises a few practical questions. That's a good thing—it means you're really thinking about how to use the numbers to make smarter business decisions. Let's tackle some of the most common queries that come up for foodservice operators.
How Often Should I Calculate Average Inventory?
The honest answer? It depends entirely on your product mix and how fast things move off your shelves.
For high-turnover, perishable items like fresh produce, dairy, or seafood, a weekly or even daily calculation is your best bet. This gives you tight control over stock levels and helps you catch potential spoilage before it eats into your profits. You can react to demand changes in near real-time.
On the other hand, for non-perishable goods like canned tomatoes, bulk spices and seasonings, or your stockpile of glassware, a monthly or quarterly calculation is usually more than enough. The most important thing here is consistency. Pick a schedule that makes sense for your operation and stick to it. This is what allows you to spot trends and make meaningful comparisons over time.
Should I Calculate by Item or by Total Value?
Why not both? Each method tells you something different, and together they give you a complete picture of your inventory's health.
Calculating the total value of your inventory gives you that big-picture financial snapshot. It's essential for high-level metrics like your overall inventory turnover rate and tells you how efficiently your entire stock is working for you financially.
But the real magic happens when you drill down to the item or category level—like beverages versus dry goods. This is where you uncover the actionable details. You'll quickly spot the slow-moving products tying up your cash and the best-sellers you need to watch closely to avoid stockouts. A combined approach truly delivers the best of both worlds.
The biggest mistake you can make with inventory isn't a math error; it's failing to use the data at all. Your average inventory figure is a powerful tool—use it to refine your purchasing, set intelligent reorder points, and optimize your stock for maximum profitability.
What Are the Most Common Mistakes to Avoid?
A few simple mistakes can throw off your numbers and lead to bad decisions. Watch out for these common slip-ups:
- Using inconsistent time periods for your beginning and ending inventory counts.
- Mixing your valuation methods (like using cost for beginning inventory but the retail price for ending).
- Forgetting to account for shrinkage from waste, theft, or spoilage.
But honestly, the most significant error is simply not acting on the information. Don't let all your hard work collecting data sit untouched in a spreadsheet.
At Chicken Pieces, we understand that smart inventory management is the backbone of a successful kitchen. From keeping your pantry stocked with the essentials to ensuring you have the right light kitchen equipment, we provide the reliable bulk supplies you need to run a smooth, profitable operation.
Explore our full range of foodservice products at chickenpieces.com